


A Synchronized Global Growth Story
The Dollar Smile Theory: Revisiting the 2017 Inauguration and the Factors Behind the Dollar's Last Peak


The hardest thing they don’t tell you about moving to a new city (like Copenhagen) is figuring out where you are on the map—what neighborhood, what street, north, south, metro station. For someone who thought they had a great sense of orientation, even after living in Copenhagen for six months, I still often find myself lost. It’s that feeling of taking the wrong road home but still having a vague idea of where you are and where you’re heading.
You’d assume most people take the same route home day in and day out—it’s easier and simpler. But I’d argue there’s a certain mental pleasure, even a challenge, in trying out new routes. What happens if, for some reason, the bridge you always cross suddenly closes? What would you do then?
Trading, in many ways, mirrors this very exercise. It’s not about questioning what’s already known but about challenging the unknown. That’s how you adapt. Every now and then, the market regime shifts, the macro environment changes, and suddenly the correlations you once relied on for profit are useless. If you don’t adapt, you lose. And when you look back, it always feels so obvious.
Being a trader and being a profitable trader are two very different things. A profitable trader gets it right at exactly the right time.
Right now, it feels like the current market regime is colliding with a new one. I can practically sense the shift in the air. And as I’ve said before, whenever I’m lost, I go back to the charts. A picture is worth a thousand words, right? If you can’t chart it, it isn’t real.
And my God—this is one hell of a chart. The U.S. Dollar (DXY) just printed a 13 DeMark Sequential on the monthly chart.
Chart 1.a: Is this finally the top for the Dollar?
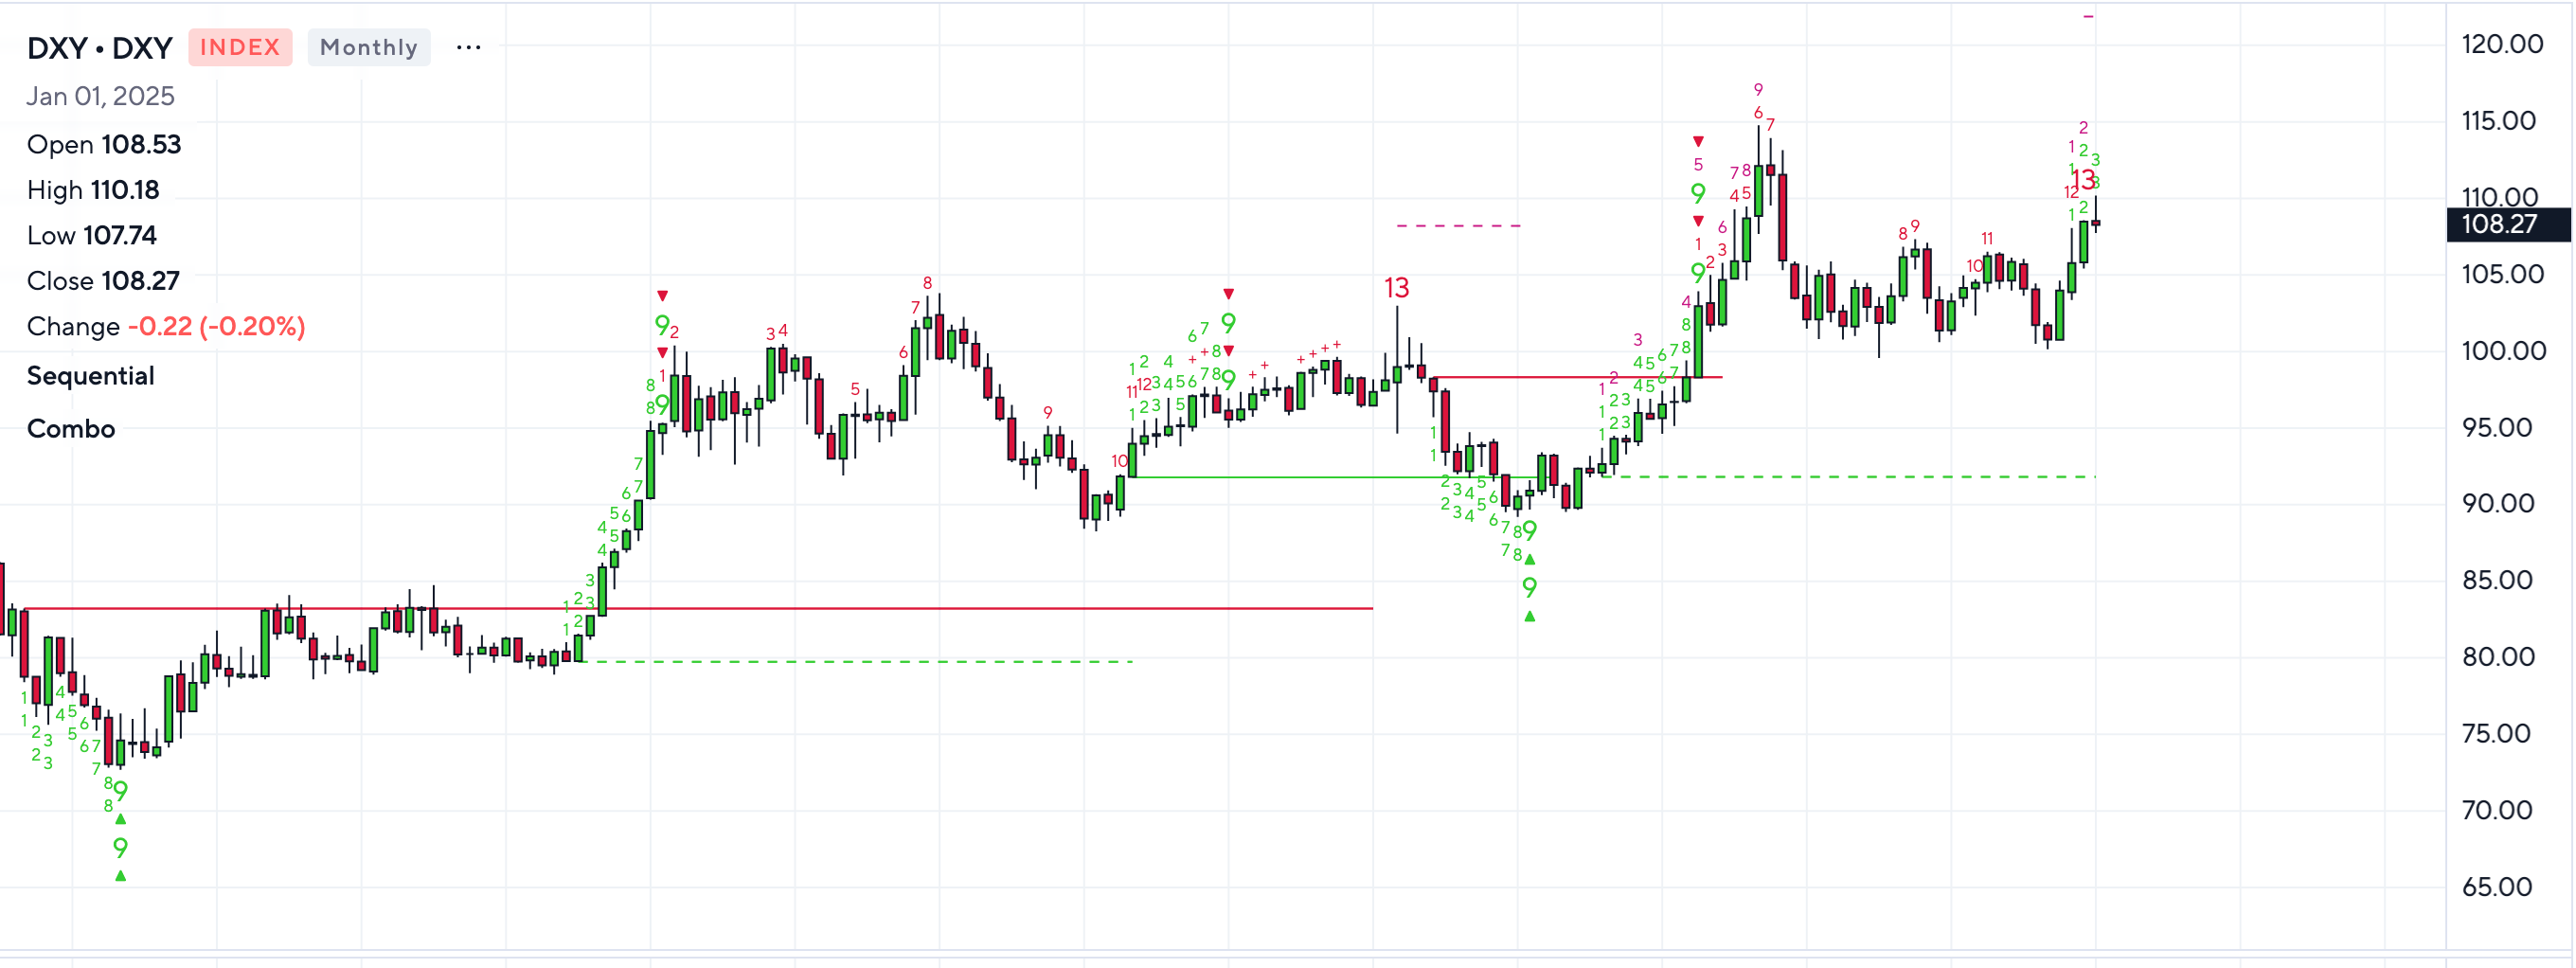
If you’re unfamiliar with DeMark, I strongly recommend exploring it. It’s one of the few technical tools I truly favor, and its importance grows with the timeframe. In this case, the chart is giving a clear SELL signal. Plain and simple. Boom.
While I touched on this in my latest blog, I’ve been flooded with questions about the dollar. Honestly, I didn’t question it myself until I saw this chart. To understand what’s happening, we need to revisit the “Dollar Smile Theory.”
Chart 1.b: The Dollar Smile Theory and “X” marking our spot in the cycle
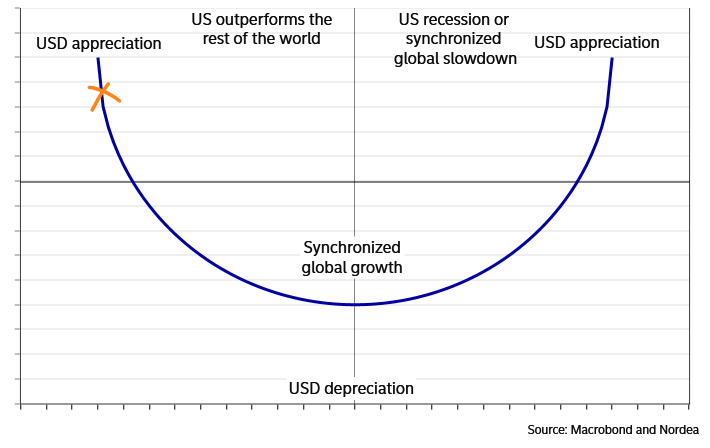
The dollar, as the world’s reserve currency, behaves differently depending on the global economic cycle:
U.S. Recession or Global Slowdown (Top Right of the Smile):
In this phase, the U.S. dollar acts as a “safe haven” asset. During major recessions, there’s a flight to safety, and people hoard cash. Makes sense, right? Think back to the start of the pandemic—markets were crashing, the world felt like it was falling apart, and everyone wanted to hold U.S. dollars.U.S. Outperforms the World (Top Left of the Smile):
This is the phase we’re in today. U.S. exceptionalism is the dominant theme. Think of the rise of AI, the dominance of the “Magnificent 7” stocks—the U.S. has outperformed significantly and, as I’ve highlighted before, still is.Synchronized Global Growth (Bottom of the Smile):
This phase is marked by global stability and muted U.S. economic performance. Risk appetite increases, and capital flows into higher-yielding currencies or risk assets.
Where Have We Been in the Cycle?
U.S. exceptionalism has been the prevailing trend ever since the rise of NVIDIA and ChatGPT. Investors have completely reshaped valuations on the backdrop of AI transforming the world, driving global flows into the U.S. This has propelled growth higher and made U.S. households nearly bulletproof. As a result, the dollar has skyrocketed over the past few years. Of course, many other factors—such as high interest rates and elevated inflation—contributed to this dollar strength.
While these fundamentals remain unchanged, there is a strong case to be made that U.S. stocks are now nearly priced for perfection. For things to continue going well, companies must surpass already lofty earnings expectations, and interest rates cannot rise further. This could lead investors to become cautious, potentially seeking higher returns in economies where fundamentals still make sense—economies where growth is picking up again and central banks are adopting a more dovish approach. As capital flows explore newer regions, we could very well enter a stage of synchronized global growth.
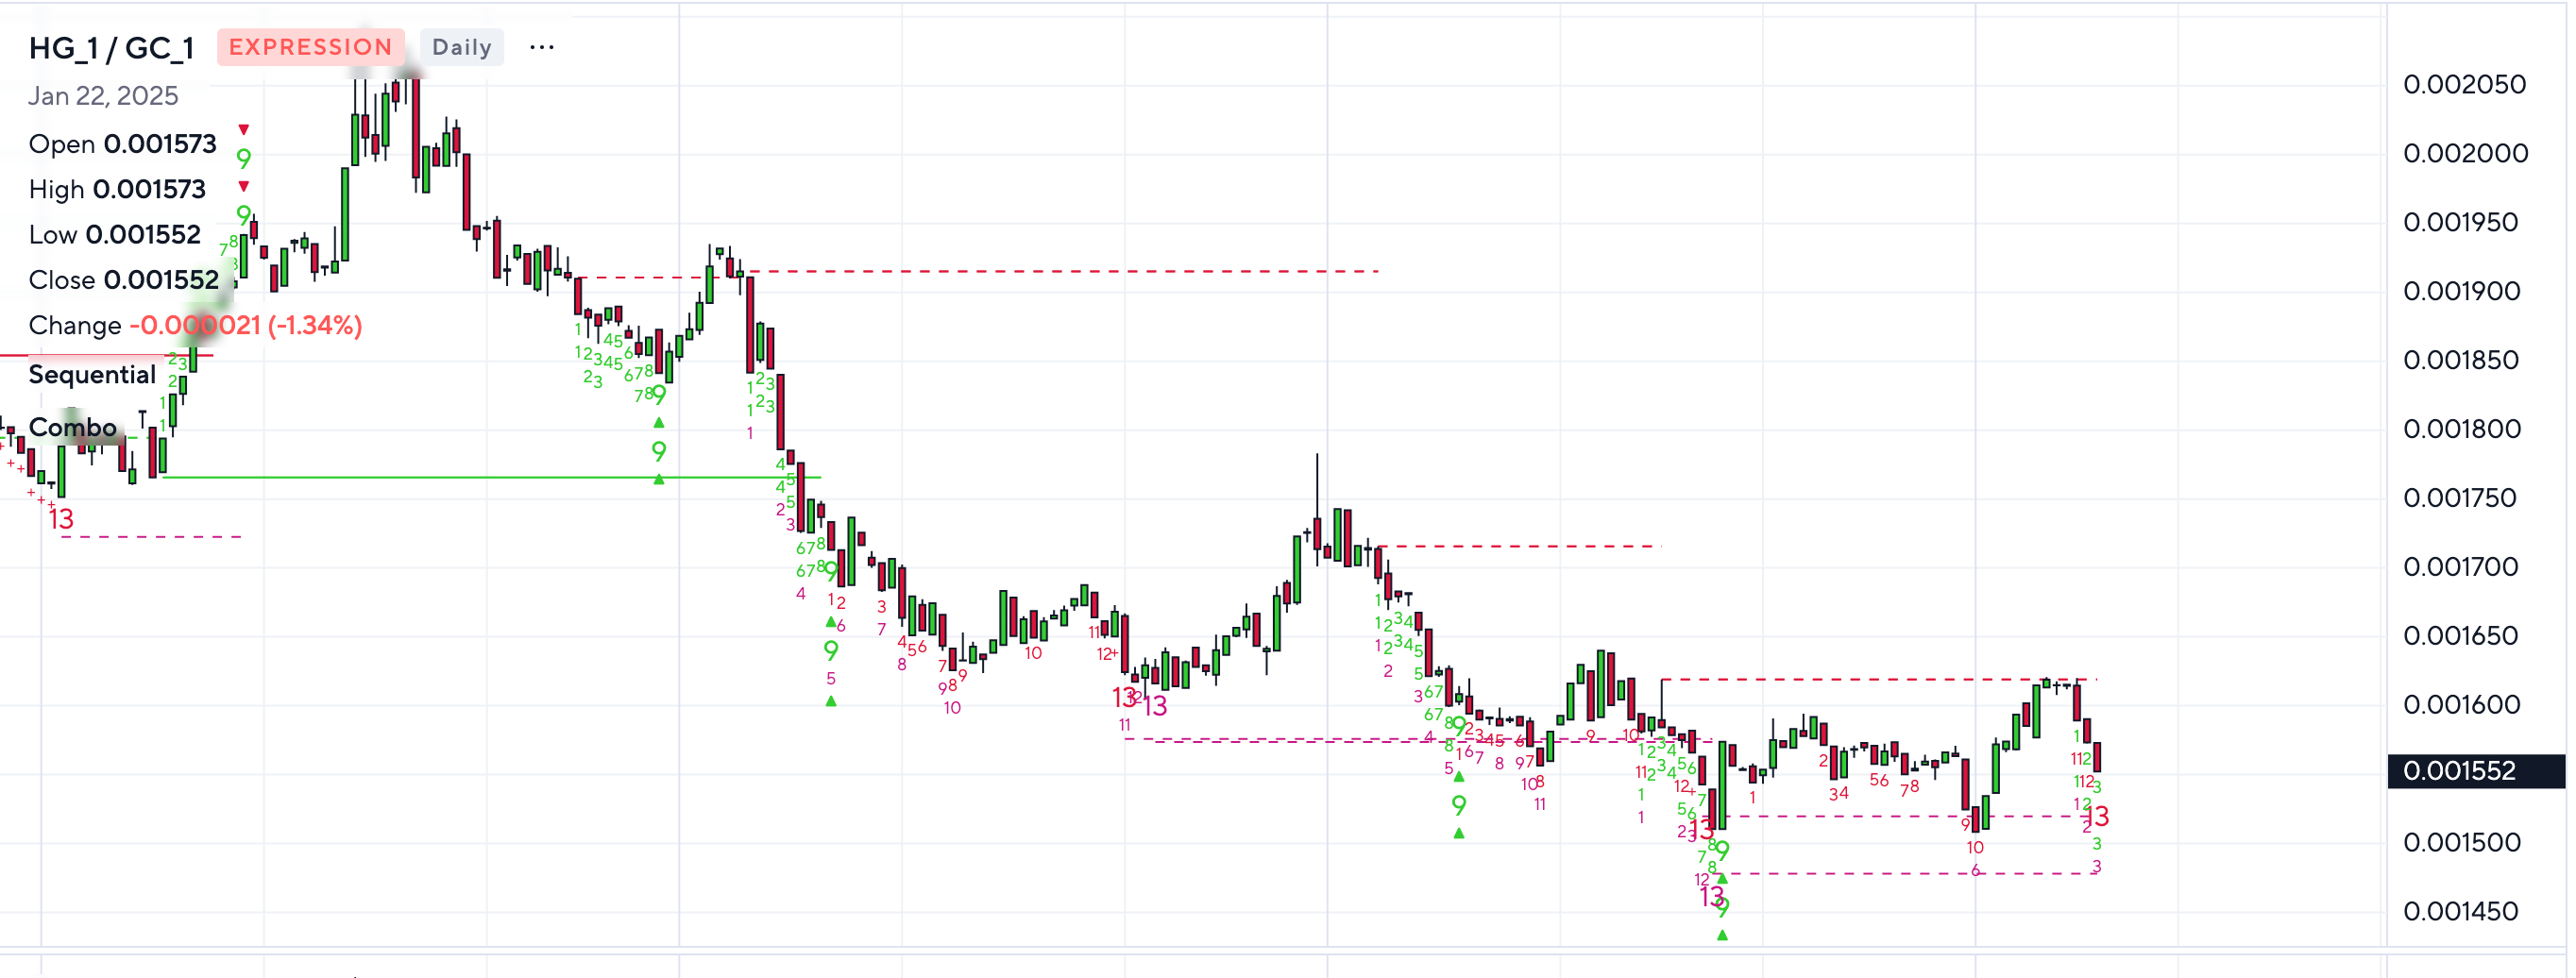
European indices already seem to be benefiting from this shift, with many nearing all-time highs as we approach 2025. It’s plausible that Europe has been boosted by spillover effects from U.S. growth. At the same time, the global manufacturing cycle appears bound for a rebound, signaling the potential start of a global business cycle in which emerging markets could finally reap benefits. A great gauge for this is the copper/gold ratio. When the ratio expands, it typically points to growth; when it contracts, it signals slowdown or recession fears. Notably, we’ve also recently seen the copper/gold ratio print a critical 13th DeMark indicator, signaling a possible turning point.
Chart 1.c: Copper-to-Gold Ratio signaling a potential "growth moment" ahead
A Surprising Shift in Rhetoric
Adding to this narrative is an unexpected shift in Donald Trump’s rhetoric. When asked about China today, he acknowledged that his relationship with Xi Jinping had deteriorated during the pandemic but suggested that this was natural under such pressure. He also mentioned that his relationship with Xi has since improved. On Europe, Trump emphasized his love for the continent and expressed a desire to negotiate “fairer” trade deals. Additionally, he has been vocal about ending the Russia-Ukraine war. For me, this didn’t sound like the combative Trump we’re used to—it seemed reasonable, even pragmatic.
At his core, Trump is a businessman. He understands that prosperity comes through peace, not war. With the upper hand that the U.S. economy holds today, it seems plausible that many countries might concede to U.S. terms simply to resume business as usual.
Short Dollar vs. Bonds: Reconciling the View
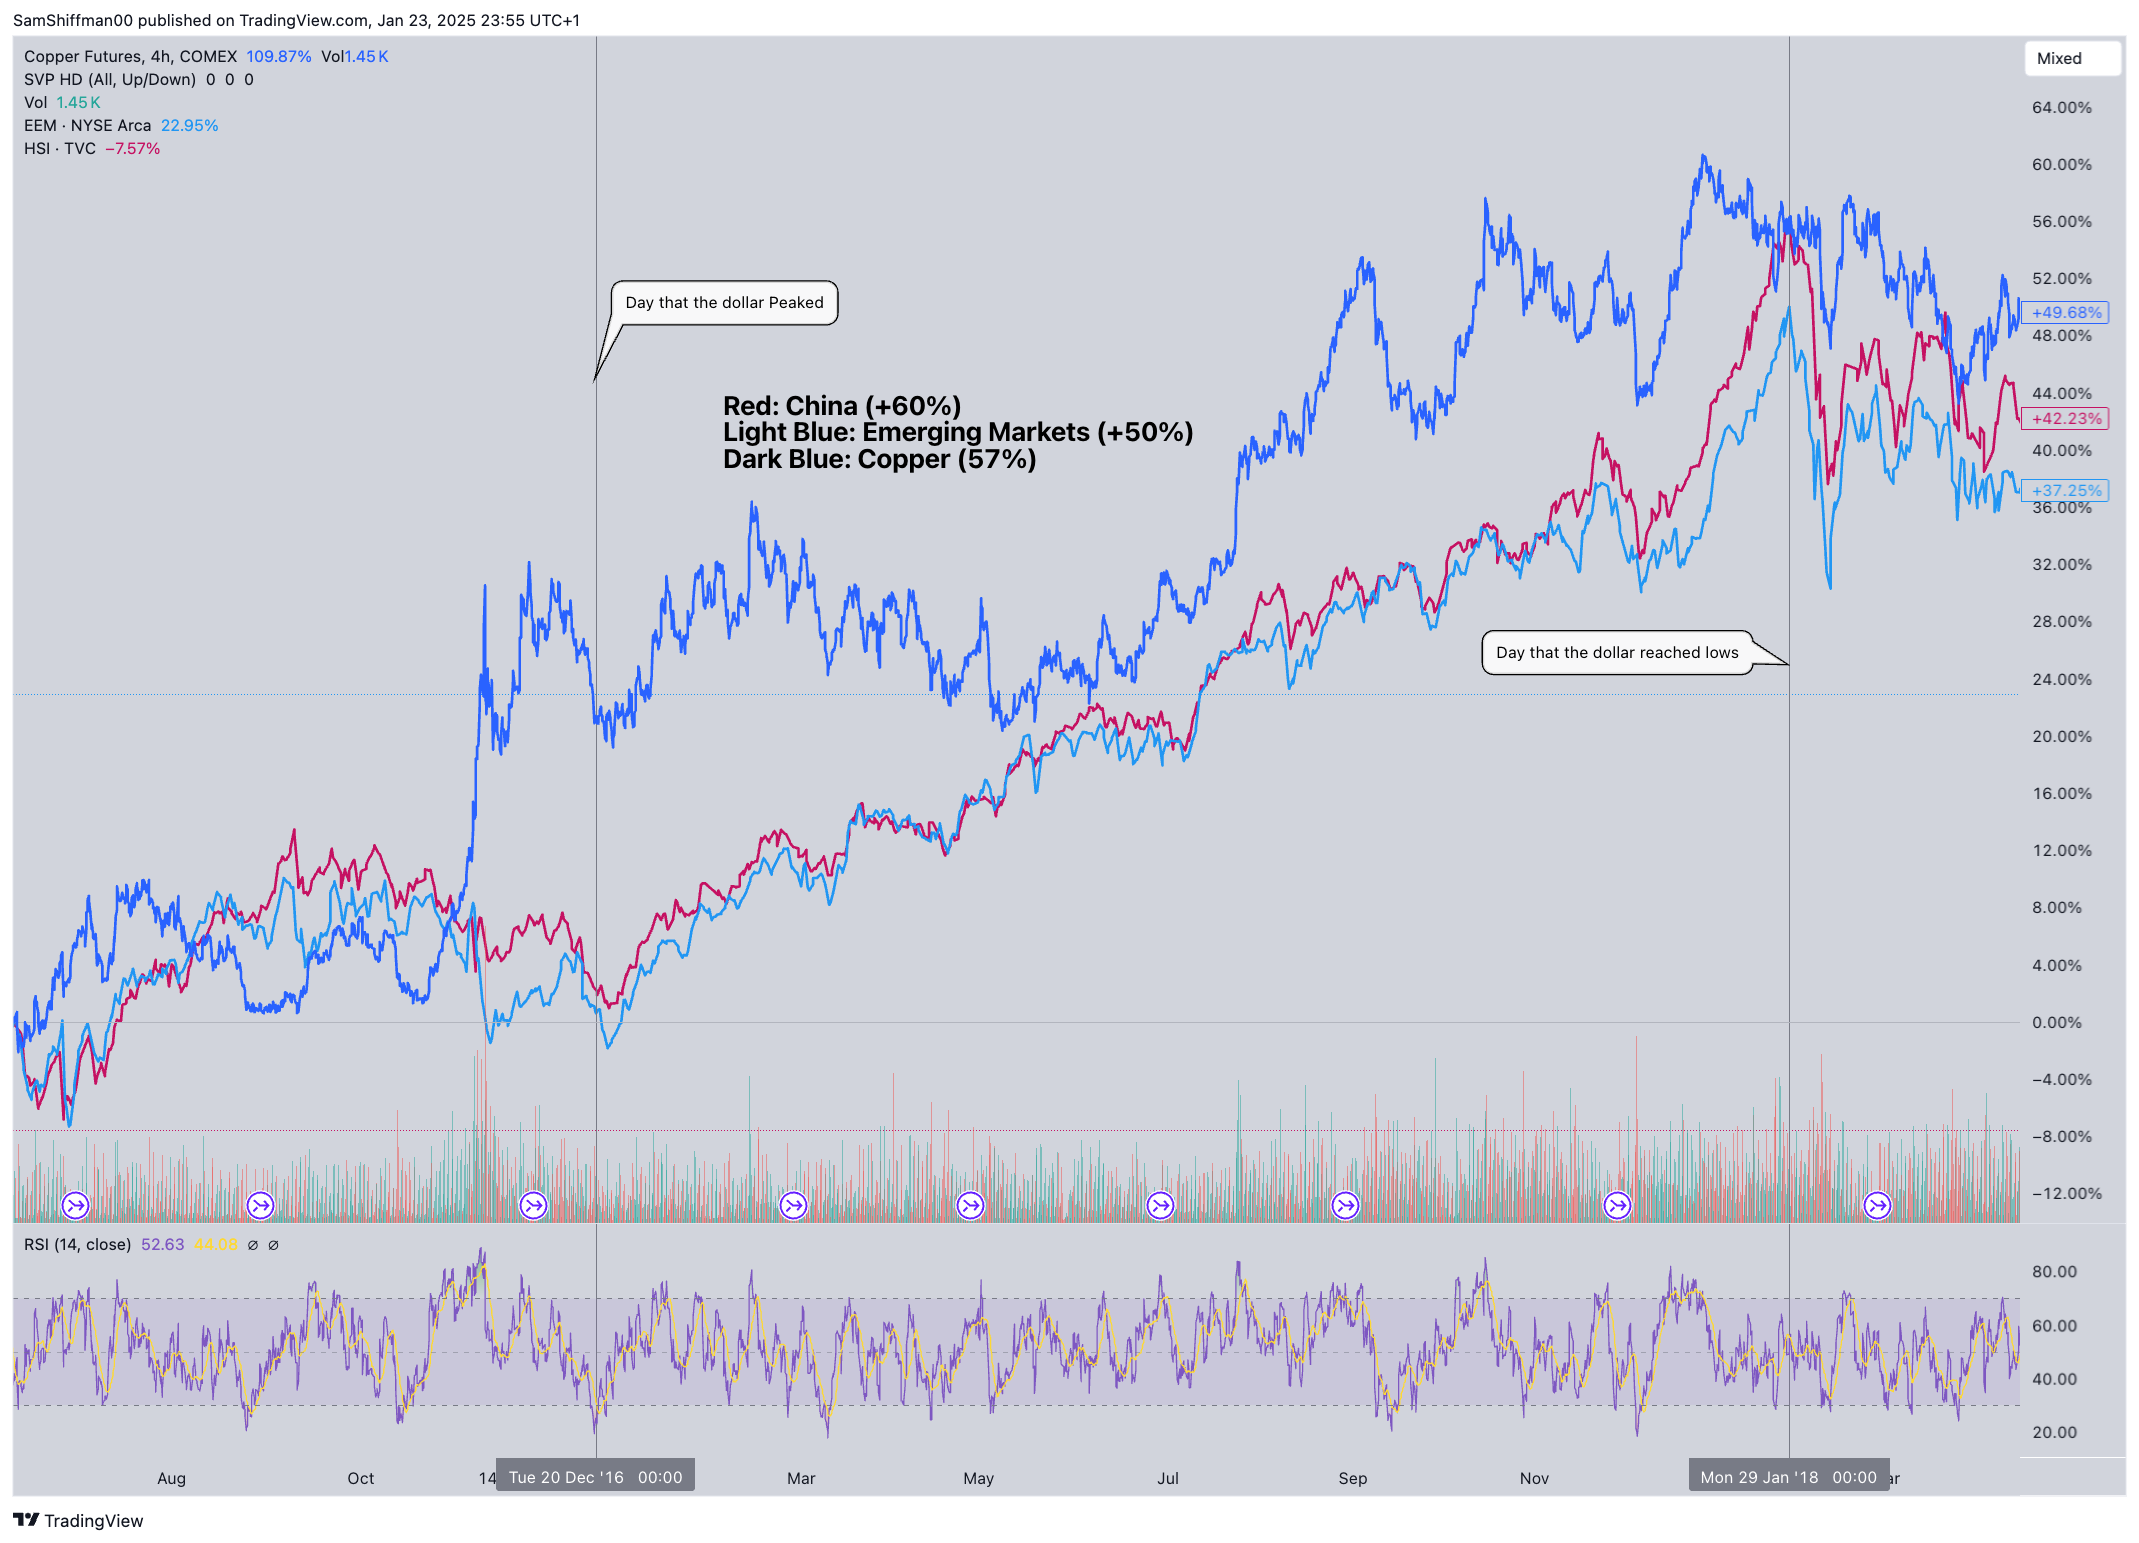
So, are you favoring a short dollar position? But you also wrote that you were short bonds—that seems contradictory, right? To reconcile this, let’s go back to January 3, 2017, just days after Trump took office. Why this date? It marked a peak in the dollar, followed by a significant decline over the next year—a situation similar to the "dollar smile" theory we’re witnessing today.
In early January 2017, skepticism around tax cuts and fiscal spending caused long-end yields to rise slightly. By the end of January, the market began pricing in the odds of the Fed hiking rates at its March meeting, spurred by stronger-than-expected economic data. This led to a bear steepening of the yield curve, with the Fed ultimately raising rates three times in 2017 and four times in 2018. As the curve flattened, inflationary pressures moderated, and the dollar sold off dramatically.
Chart 2.a: History suggests the dollar typically weakens after the yield curve bear-flattens.
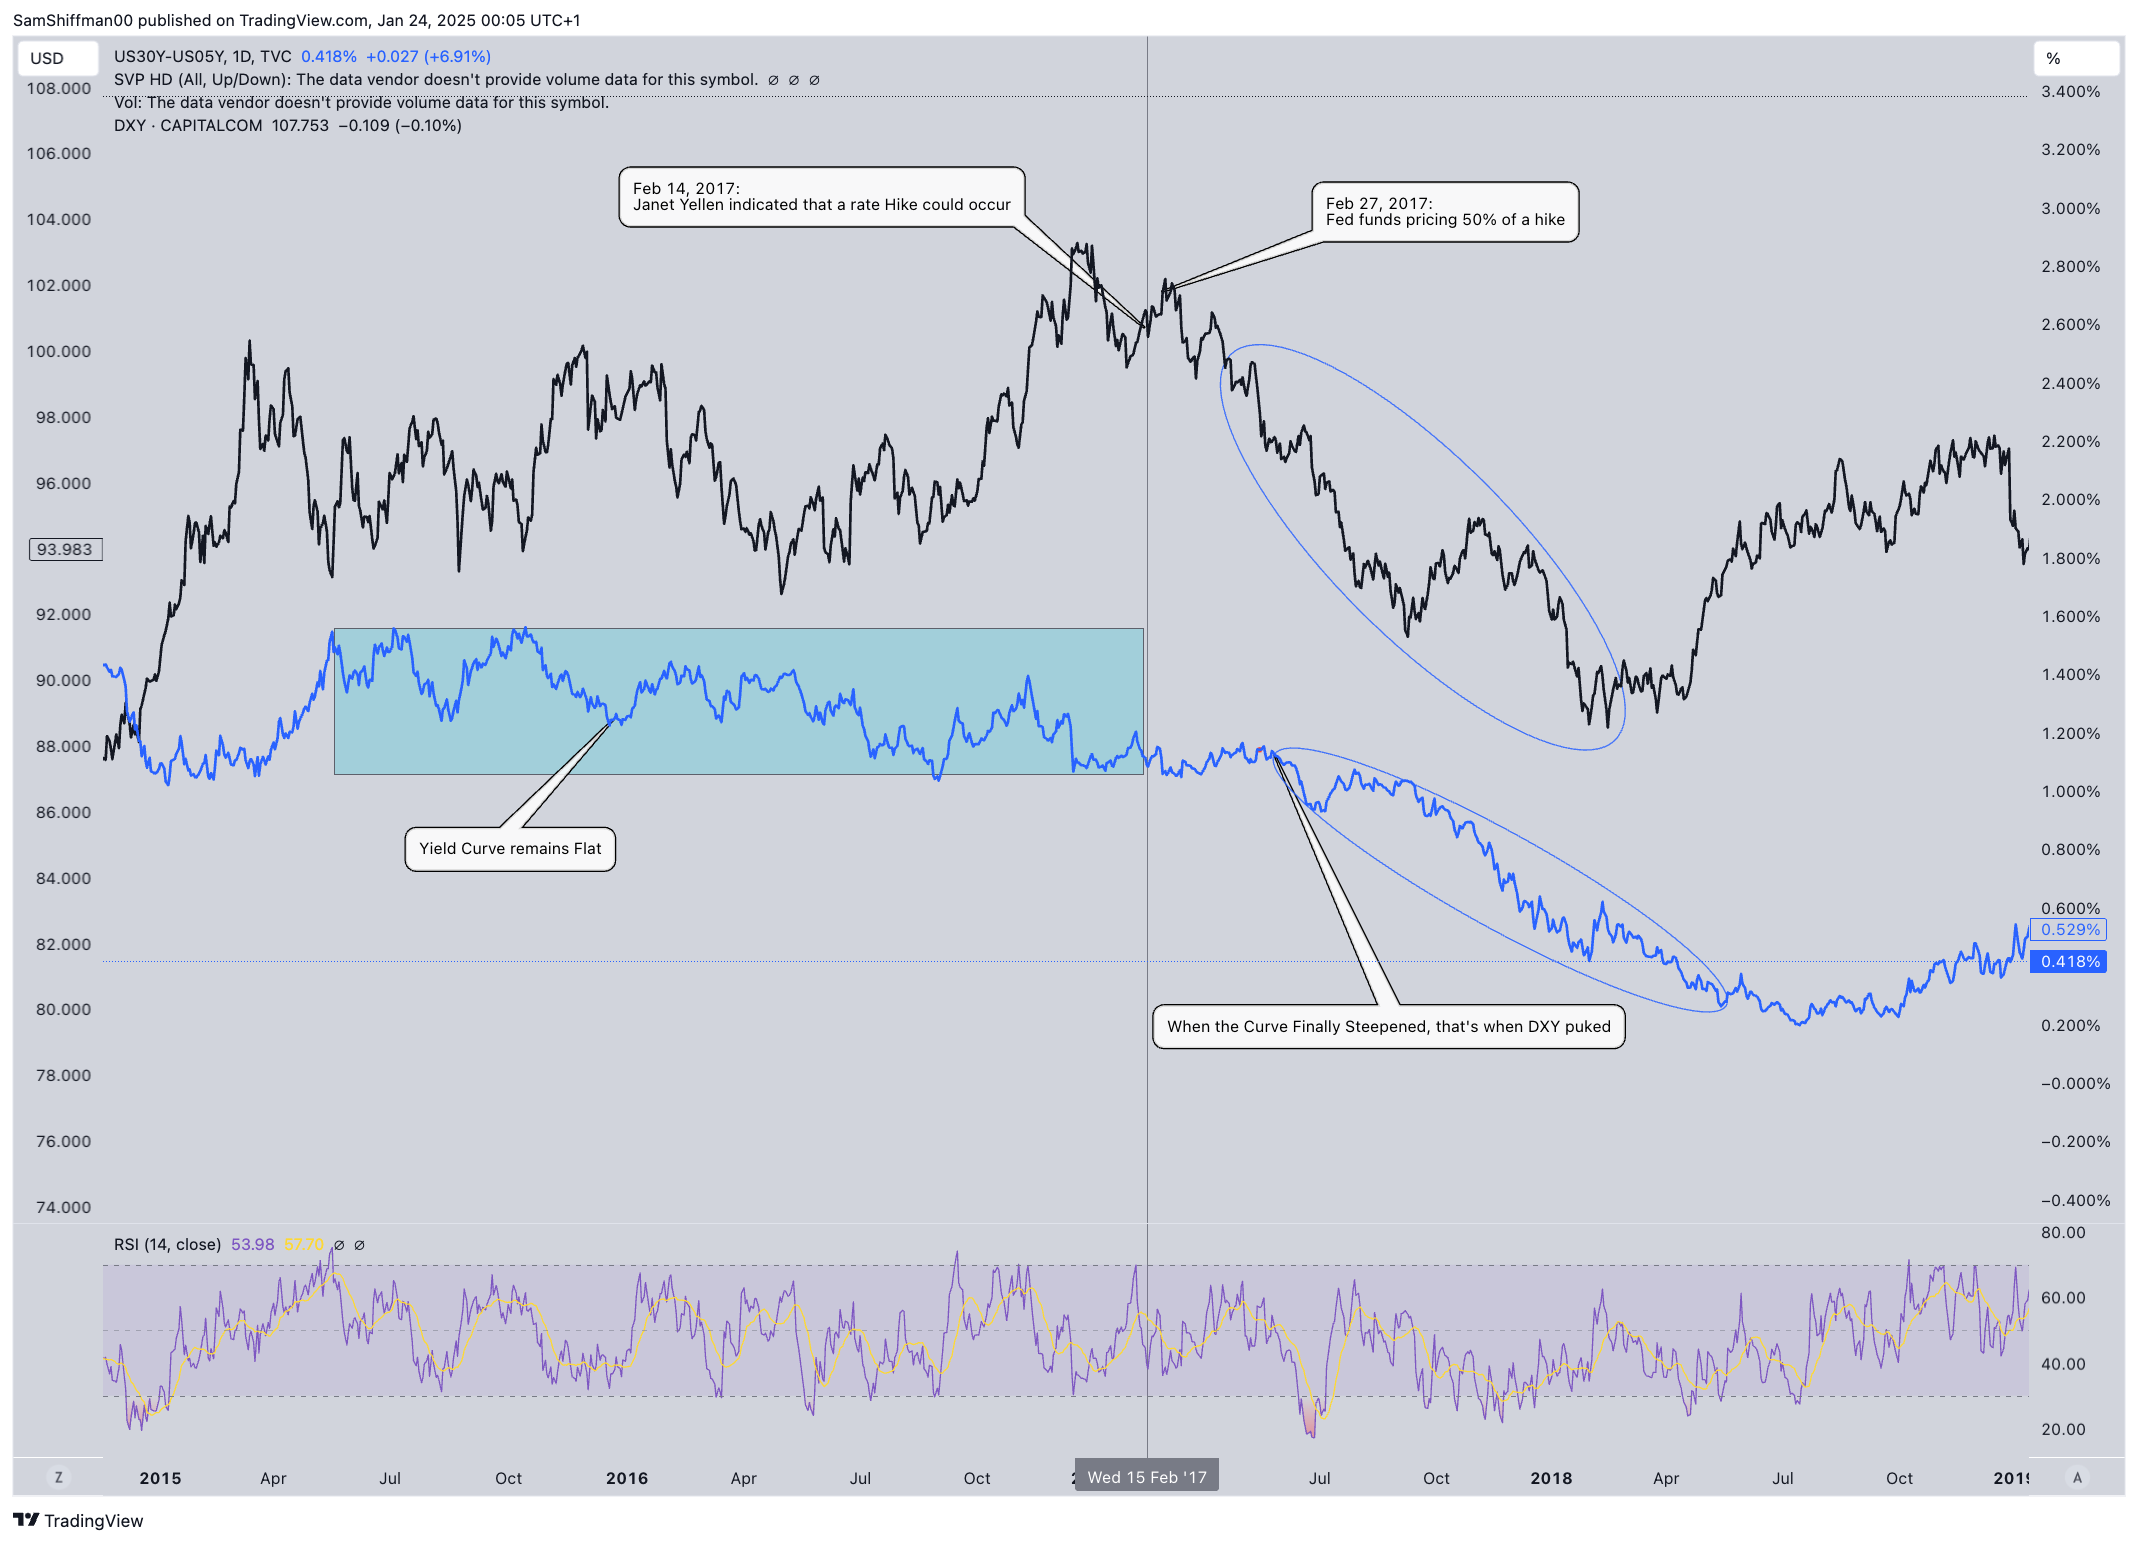
As I mentioned in my previous blog, the Fed isn’t even close to considering rate hikes. Since the January dollar index print, we’ve still got some time before any real selloff kicks in. For that to happen, we’ll need to see strong and consistent data to push the Fed into action and get the market to start pricing in that risk. As we’ve pointed out, the flatter the curve (and the higher rates go), the less appealing U.S. investments become. That’s when the true Dollar Smile comes into play, and we step into the Synchronized Global Growth phase.
I’ve included this chart to give you a sense of what tends to perform well in this type of setup, but there are plenty of plays that could work. I’ll let you guys do some digging—feel free to share your thoughts on the best-performing assets for this kind of environment!
Personally, my portfolio leans heavily on commodities and China-focused themes, which have been solid performers. I’m considering adding EEM (MSCI Emerging Markets) but will follow up with more trade ideas soon. One thing to emphasize: none of this can truly play out unless we see the Fed turn decisively hawkish.
Chart: 2.b: What typically outperforms when the dollar tanks
Until Next Time…
Sam
Please note that the content provided above is for informational purposes only and should not be considered financial advice. Always conduct your own research and consult with a qualified financial advisor before making any investment decisions.