


Are We Nearing the Top? A Dalio-Inspired Market Analysis
Using Ray Dalio’s checklist to find out if the market’s topping or just having a good time.


Over the weekend, I revisited Ray Dalio’s Big Debt Crises
This book is a masterclass in understanding macroeconomic cycles. It provides a framework that acts like a macroeconomic compass, illuminating how booms and bubbles are formed. Dalio explains that these cycles are driven by unsustainable debt growth, where individuals, corporations, and governments become so over-leveraged that, when the bubble bursts, it takes everything down with it.
With that in mind, I found myself reflecting on the current state of the U.S. business cycle—especially with the recent rally in crypto. It’s got everyone asking: “When will it top?”
What Tops Look Like According to Dalio
Dalio’s framework offers a checklist of conditions that signal when markets are nearing their peak. Tops, he explains, form when the following questions increasingly get a resounding “yes”:
Are prices high relative to traditional measures?
Are prices discounting future rapid price appreciation?
Are purchases being financed by high leverage?
Are buyers or companies making forward purchases?
Have new participants entered the market?
Is there broad bullish sentiment?
Does tightening risk popping the bubble?
Inspired by Dalio’s checklist, I thought it would be a worthwhile exercise to answer these questions for the current market environment. By applying this framework, we can better understand whether we’re nearing a top—or if there’s still room to run.
The Plan
To make this analysis concrete, I’ve pulled together a series of charts. For each question, I’ll assign a score out of 5, where:
5 = Strong agreement (a heavy "yes").
0 = No indication of a top.
Let’s dive in and see what the data tells us!
Are Prices High Relative to Traditional Measures? 3/5
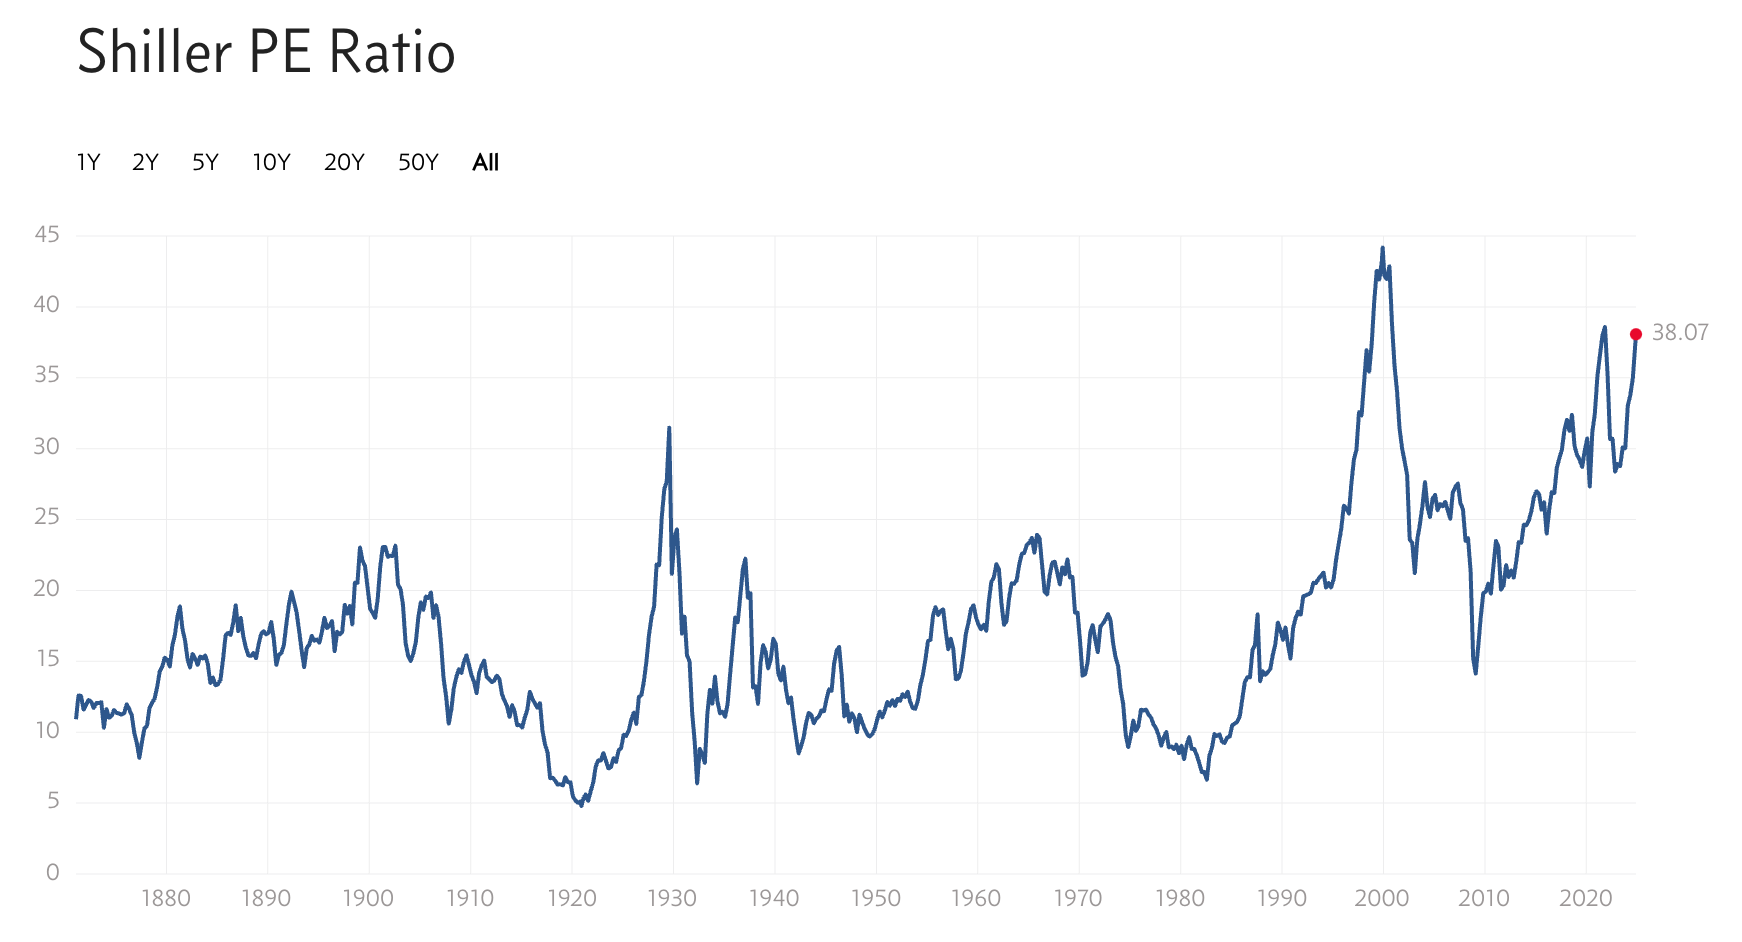
The Shiller P/E ratio, which compares stock prices to their earnings, is climbing back toward COVID-era highs. While this signals elevated valuations, we’re still far from the extremes of the Dot-com bubble. With the current “AI bubble” drawing comparisons to that era, there’s room for the ratio to climb further before entering unsustainable territory.
Chart 1.a: Shiller P/E Ratio Approaching COVID Highs
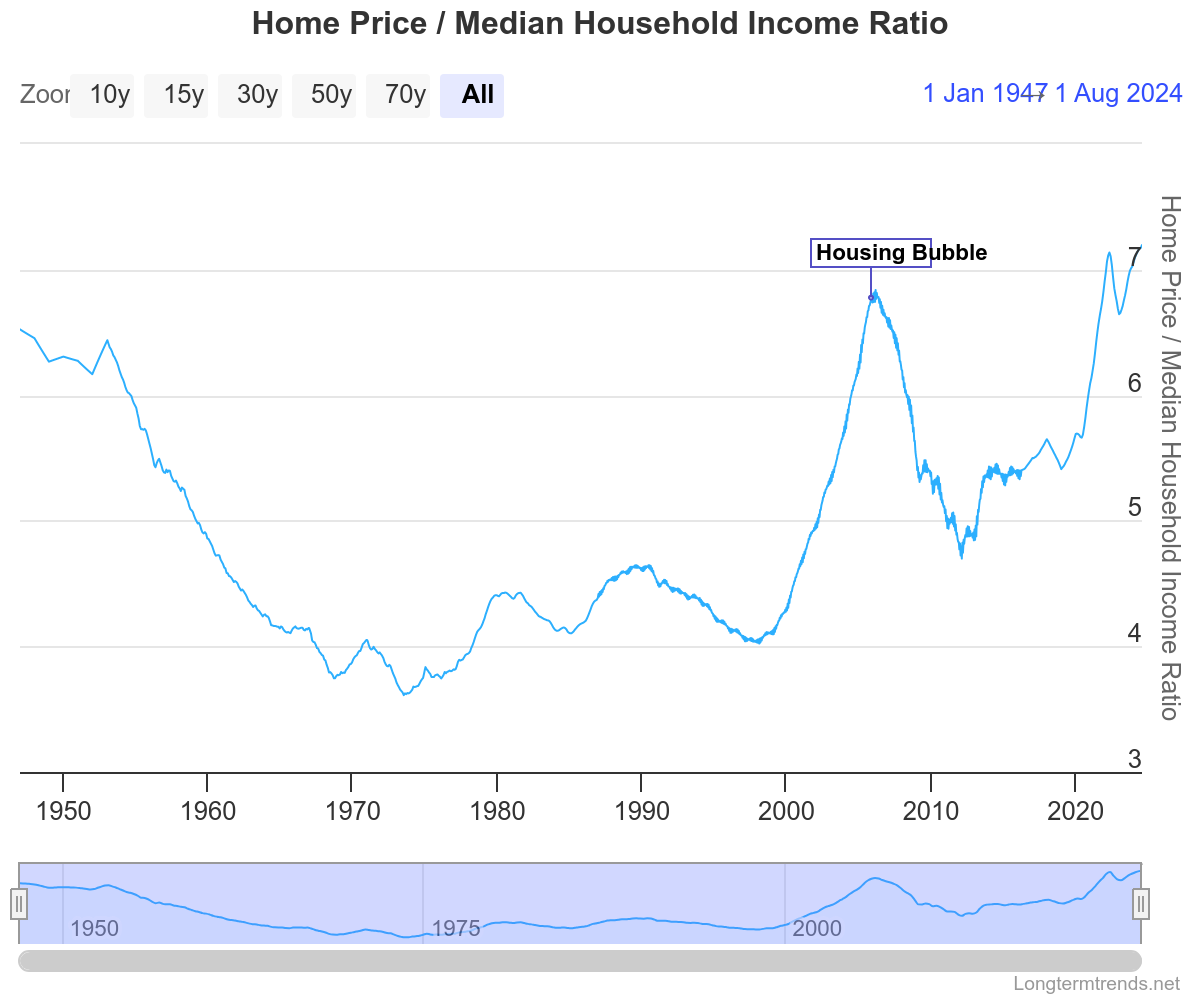
Switching to home prices relative to household income, the ratio is near all-time highs, which could be concerning. However, high immigration and robust U.S. economic growth have prevented the sharp declines in home prices that many expected when the Fed began its hiking cycle. While the ratio has exceeded levels seen during the Housing Bubble 16 years ago, the natural upward trend over time suggests these levels may not yet be unsustainable.
Chart 1.b: Home Prices vs. Household Income Near All-Time Highs
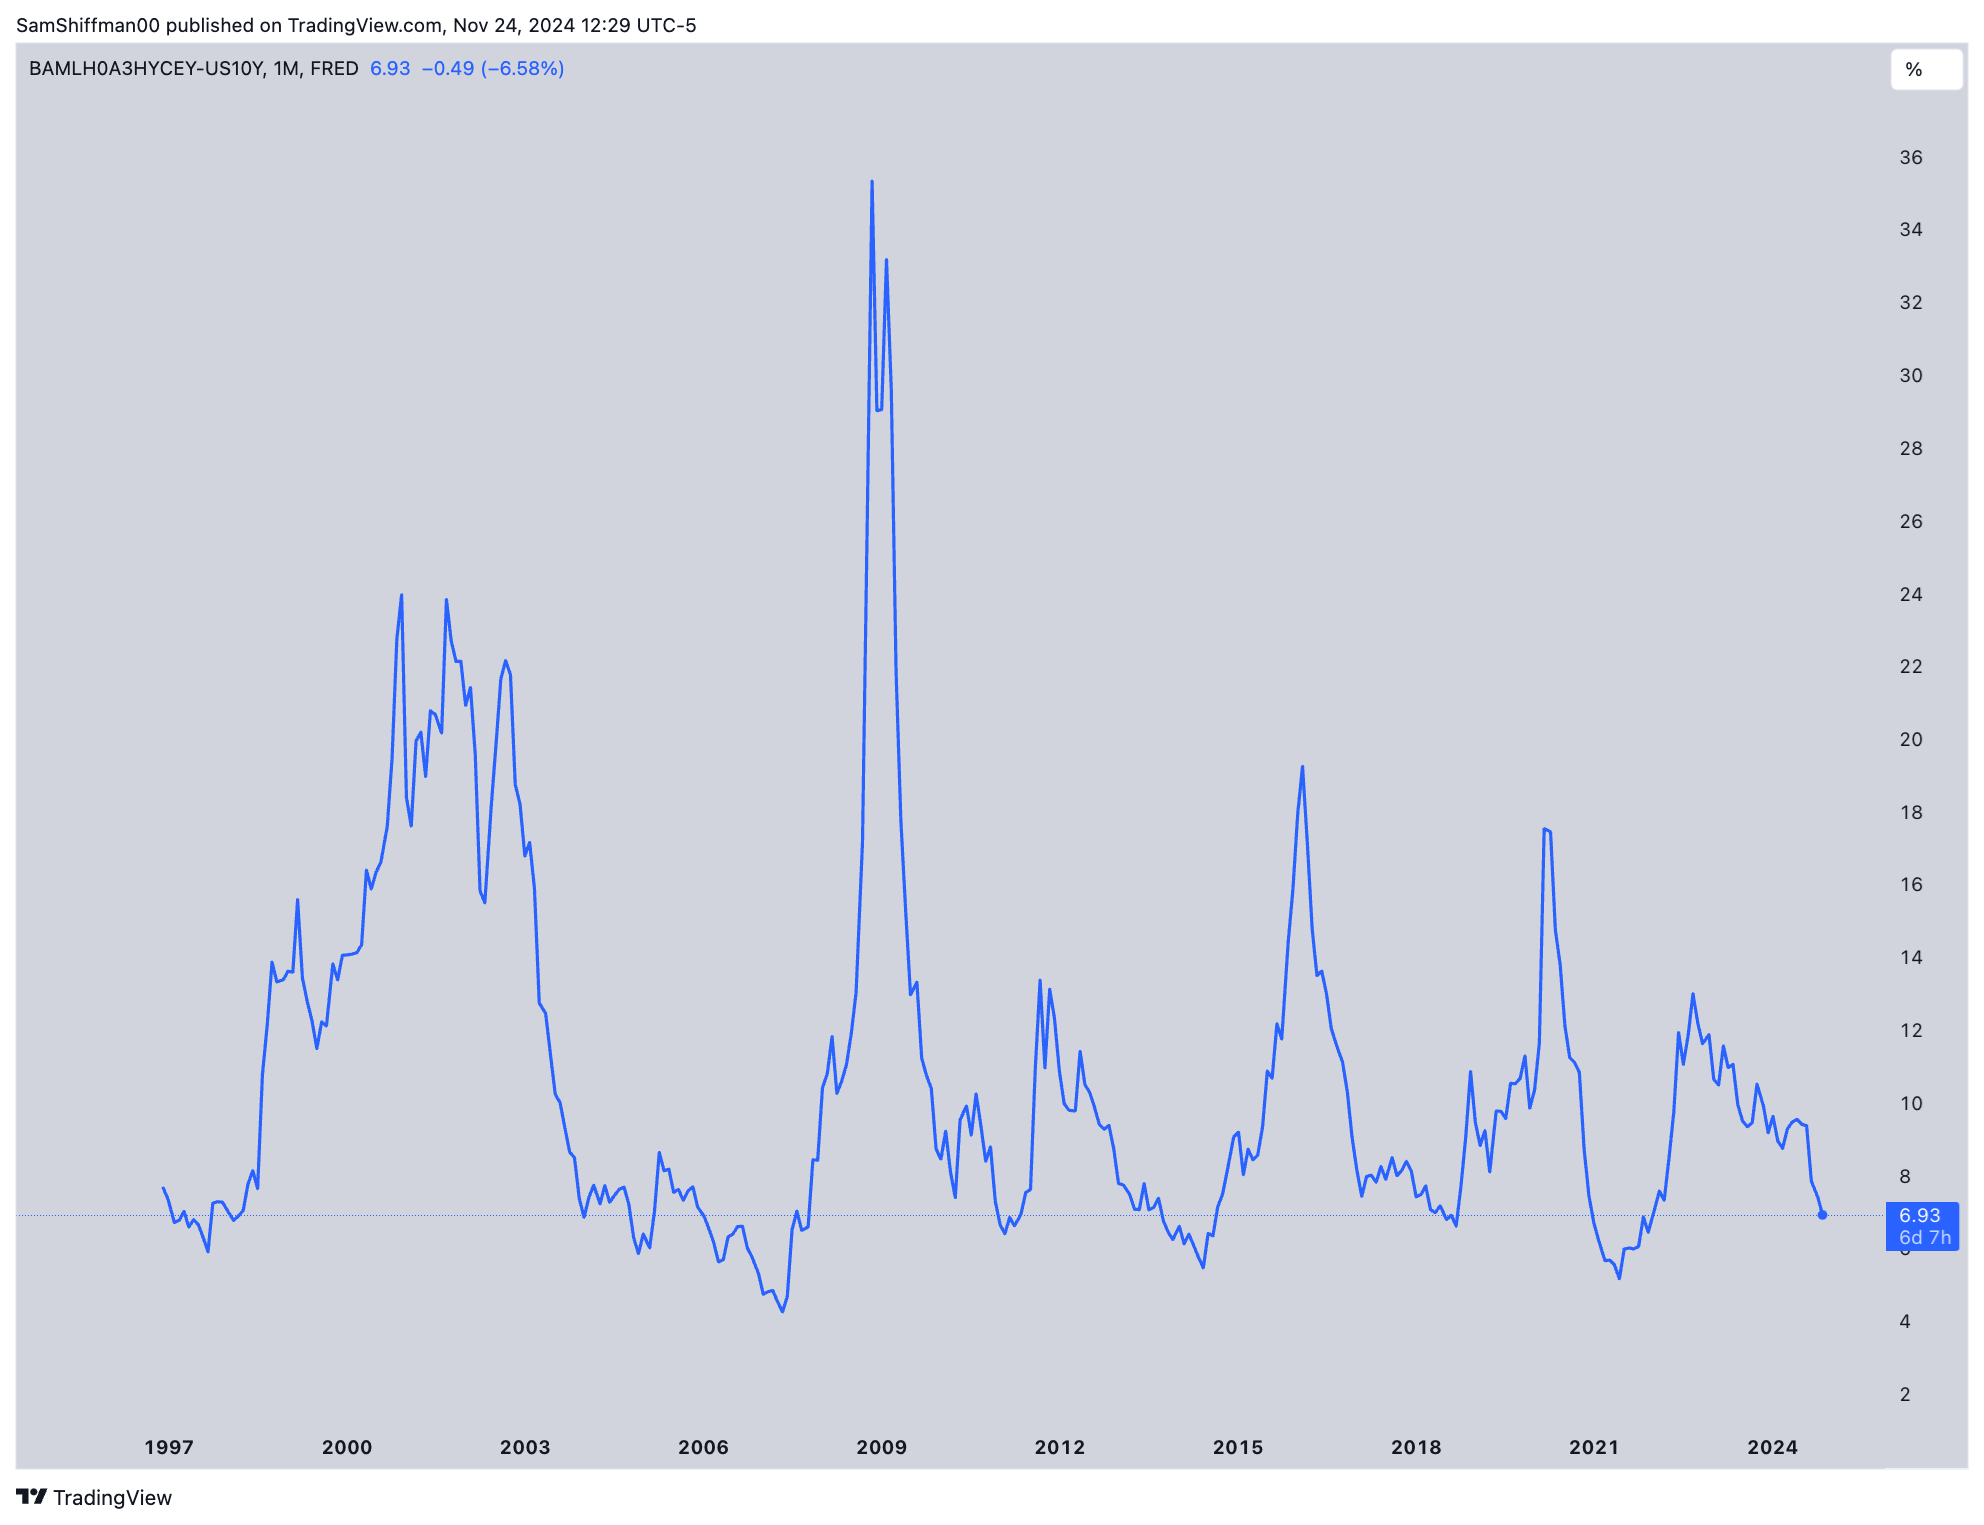
For credit spreads, the persistent tightening aligns with speculative behavior, as investors chase yields in riskier assets like high-yield bonds or equities. While this trend signals growing risk appetite, there’s potential for spreads to tighten further, pushing markets deeper along the risk curve.
Chart 1.c: Tightening Credit Spreads and Growing Speculative Behavior
Are Prices Discounting Future Rapid Price Appreciation? 4/5
During the Dot-com bubble, tech stocks traded at stratospheric valuations based on anticipated rapid growth in internet businesses. When that growth failed to materialize, prices collapsed. Today, we see similar dynamics with companies like NVIDIA, where stock prices reflect high expectations for AI-driven growth. Investors seem to have “priced in” a future where AI delivers transformative returns. However, NVIDIA’s consistent earnings beats continue to push valuations higher. While this feels like walking on thin ice, the latest earnings were decent, leaving us to wait once again for the next quarter to gain insight into whether these expectations are justified.
Are Purchases Being Financed by High Leverage? 2/5
Current leverage levels remain far below the speculative peaks of 2000 or 2006. Margin balances, while rising off recent lows, remain historically modest, reflecting cautious sentiment. On the corporate side, business credit growth is subdued, with stricter lending standards curtailing speculative borrowing. However, potential future deregulation under a more pro-market administration and rate cuts by the Fed could soften lending standards, spurring higher demand for loans. For now, leverage remains a moderate factor.
Chart 2.a: Buying Stocks on Margin Seem Subdued Compared to 2000 and 2006

Chart 2.b: Loans and Leases Remain Subdued

Are Buyers or Companies Making Forward Purchases? 3/5
On the consumer side, new home sales have stayed flat despite high interest rates, reflecting prudence in spending. Inflation and rate hikes have weighed on sentiment, but improving ISM indices and potential Fed rate cuts suggest a brighter outlook. U.S. consumer spending remains resilient, far from the recessionary fears that dominated earlier this year.
For businesses, new orders—a leading indicator by about two months—show cautious optimism. Companies appear to anticipate a rebound in the business cycle, but current levels are far from speculative highs, indicating restrained forward purchasing for now.
Chart 3.a: New Houses Sold, Not Started.

Have New Participants Entered the Market? 3/5
U.S. equity markets are undeniably drawing substantial attention, with a record $448 billion in YTD inflows. This reflects the resilience of U.S. stocks and the broader economic outlook, which continues to outshine much of the global economy. For now, this trend feels likely to persist, as investors remain confident in the relative strength of the U.S.
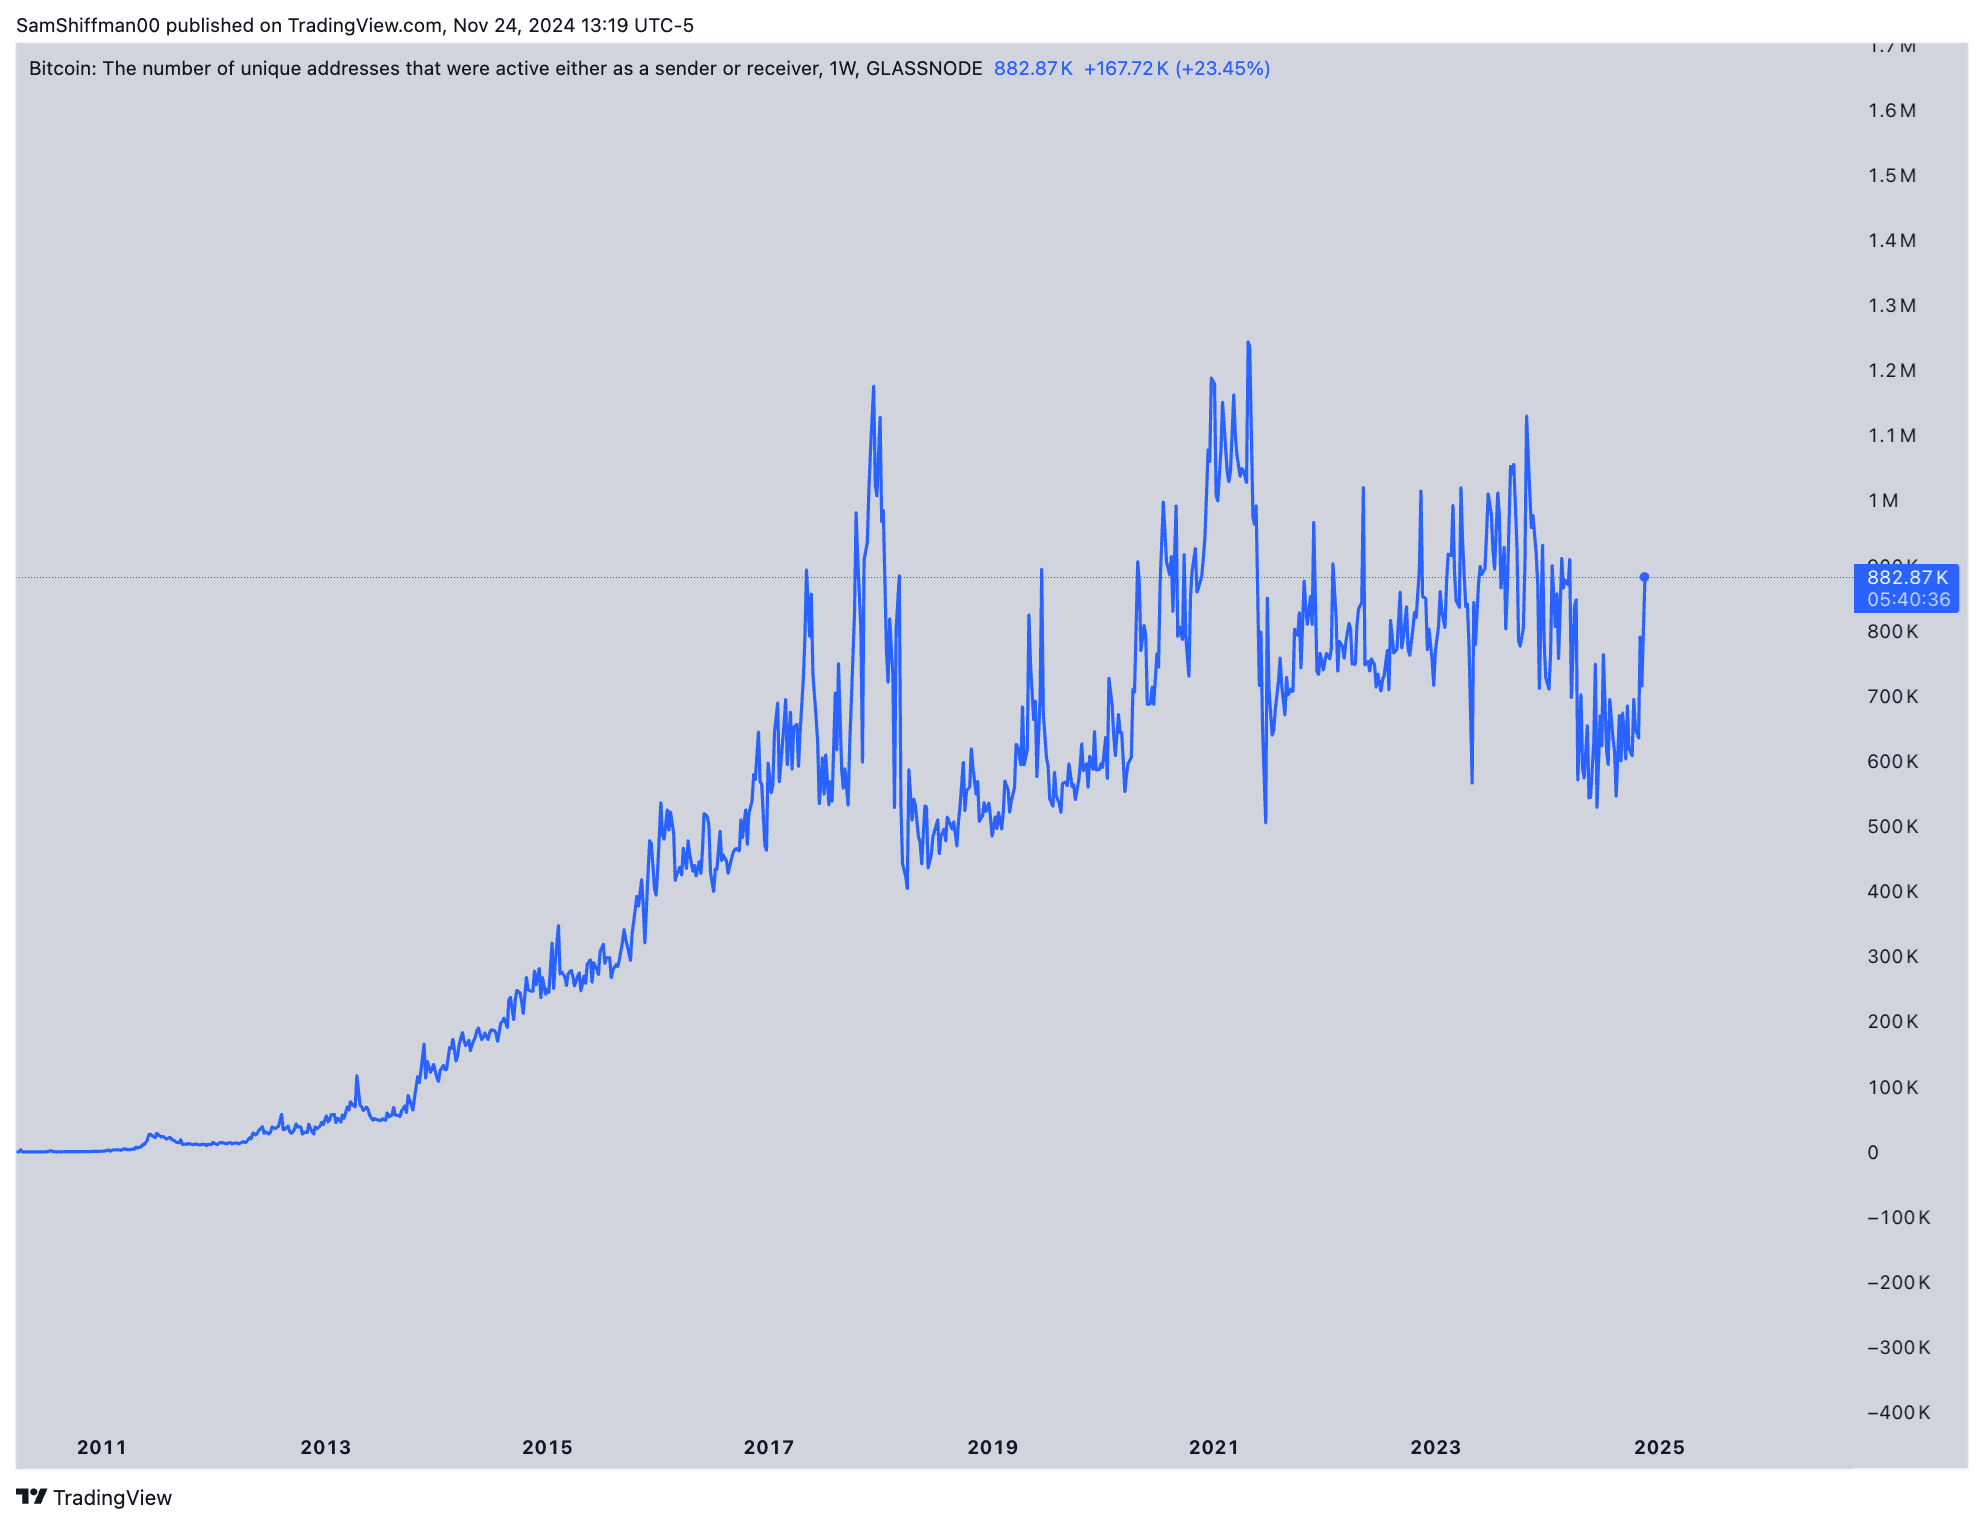
Turning to crypto, despite Bitcoin hovering around the $100K mark, the number of active addresses remains far from the highs seen in 2017 and 2021. This suggests that the current bull cycle is driven more by institutional adoption than a surge in retail participation. As a result, the crypto market feels far from speculative saturation levels at this stage.
Chart 4.a: Equity Inflows Hit $448 Billion YTD
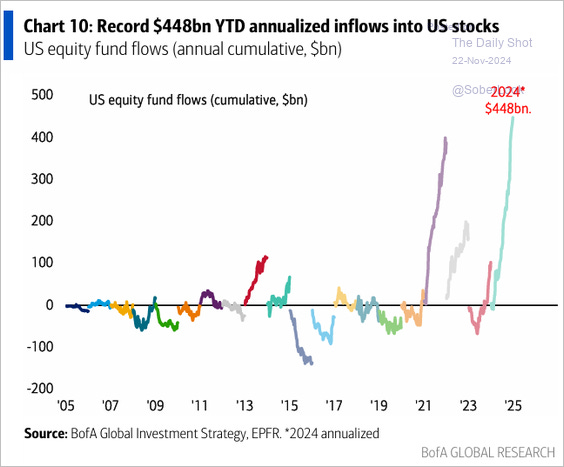
Chart 4.b: Crypto Adoption: Institutional vs. Retail Dynamics
Is There Broad Bullish Sentiment? 4/5
In the crypto space, the Fear and Greed Index has surged into “extreme greed” territory at an unusually rapid pace. However, when looking at Google search trends for "crypto," the current levels of public interest remain well below the peaks of previous cycles, indicating that speculative mania hasn’t fully returned.
For equities, the options chain data points toward a bullish tilt, but the market isn’t displaying the extreme speculative behavior that would typically mark a bubble’s peak. Bullish sentiment exists, but it hasn’t reached worrisome highs yet.
Chart 5.a: Fear and Greed Index Hits ‘Extreme Greed’ in Crypto
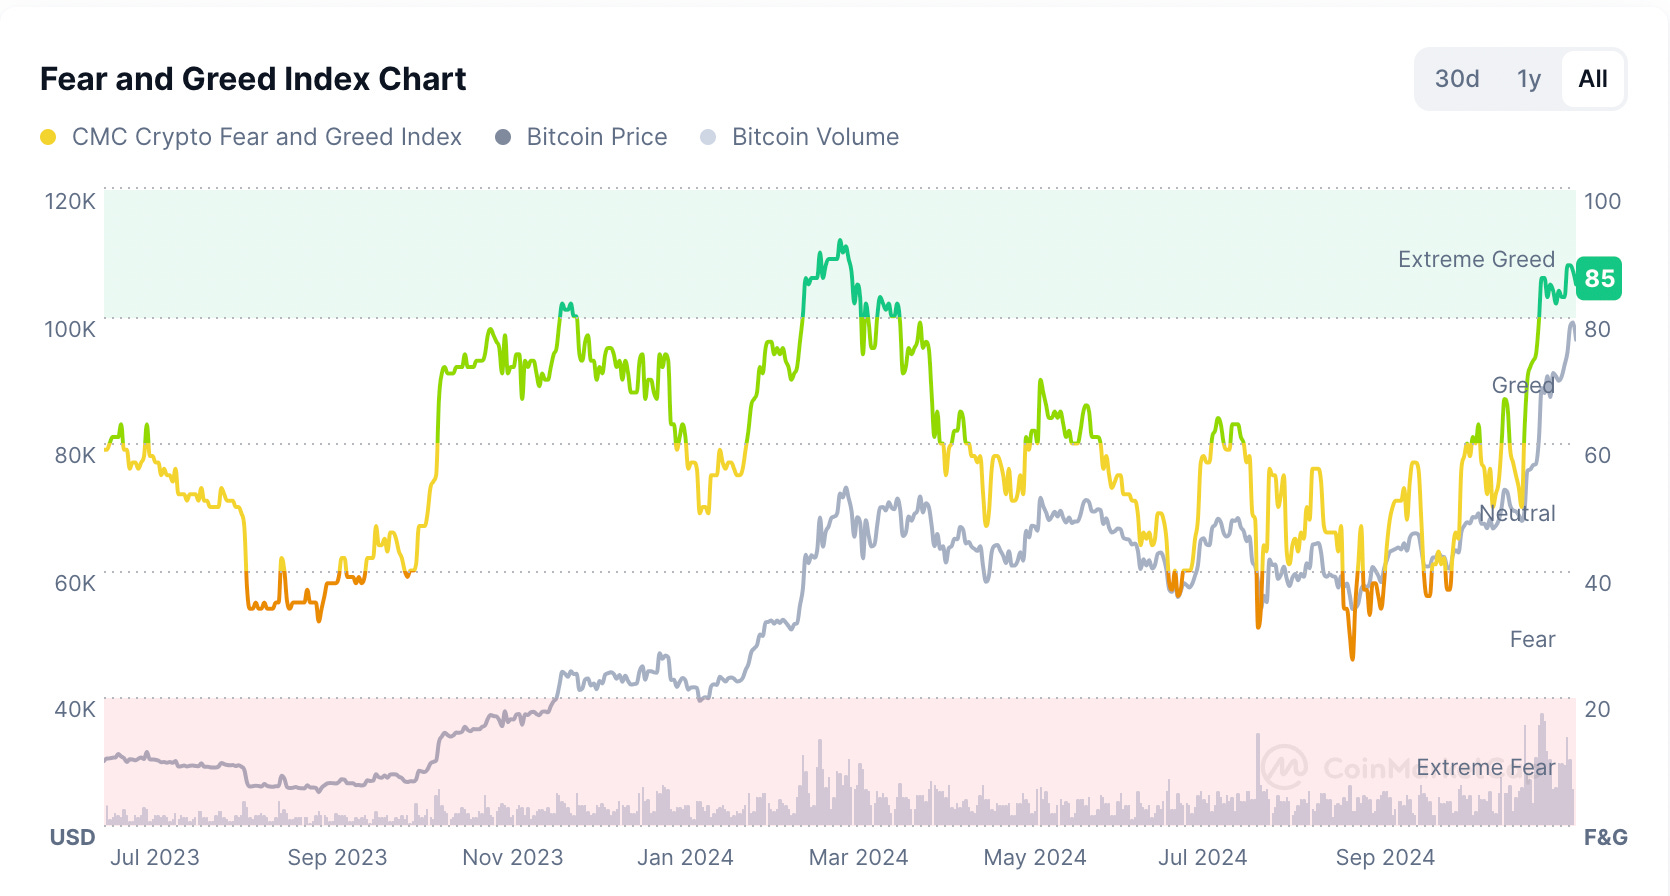
Chart 5.b: Google Search Trends for 'Crypto'
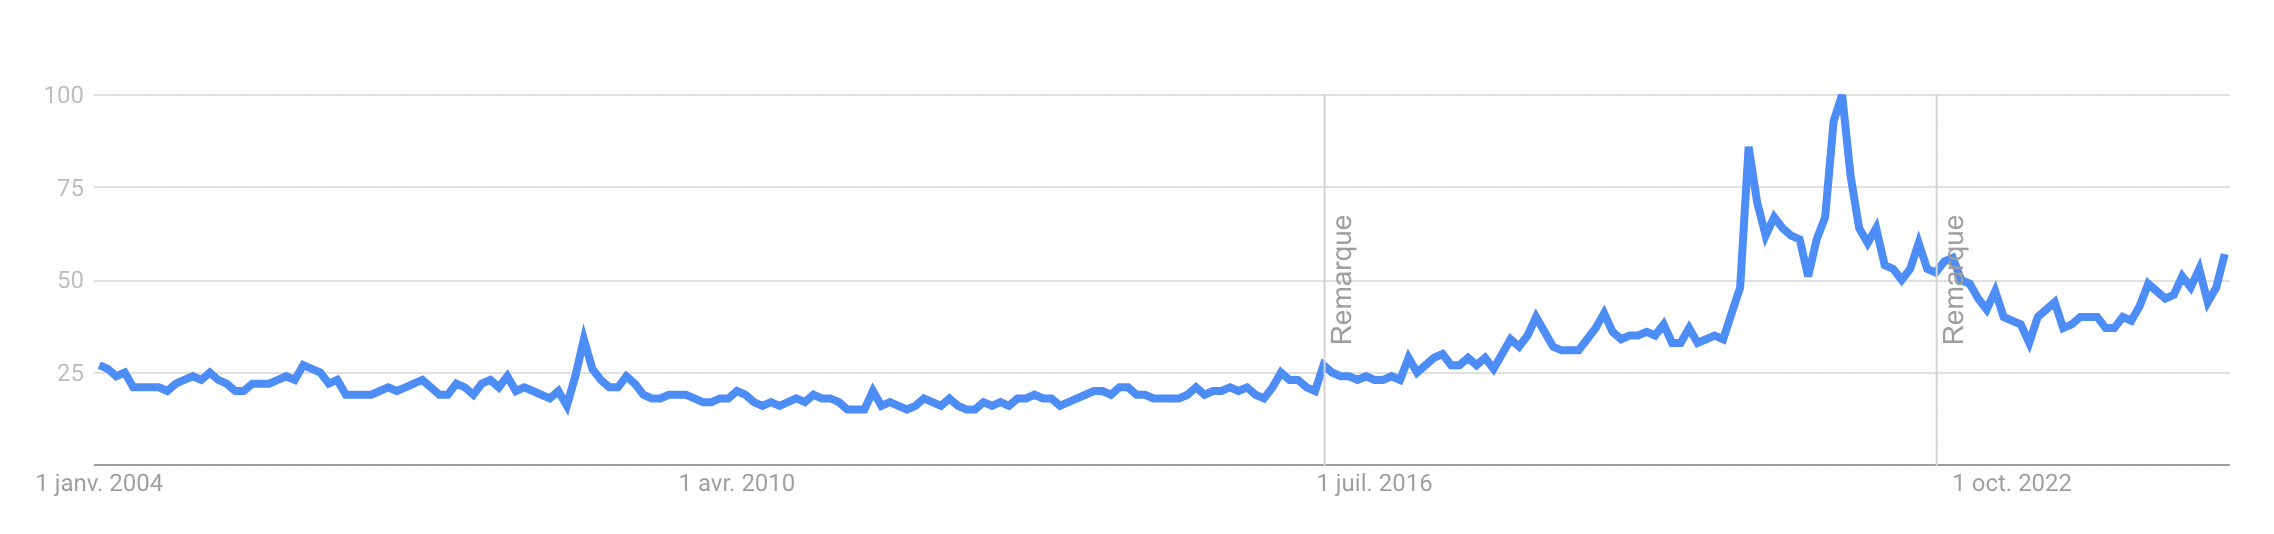
Chart 5.c: Bear Spread Reflects Moderation, Not Excessive Bullishness

Does Tightening Risk Popping the Bubble? 2/5
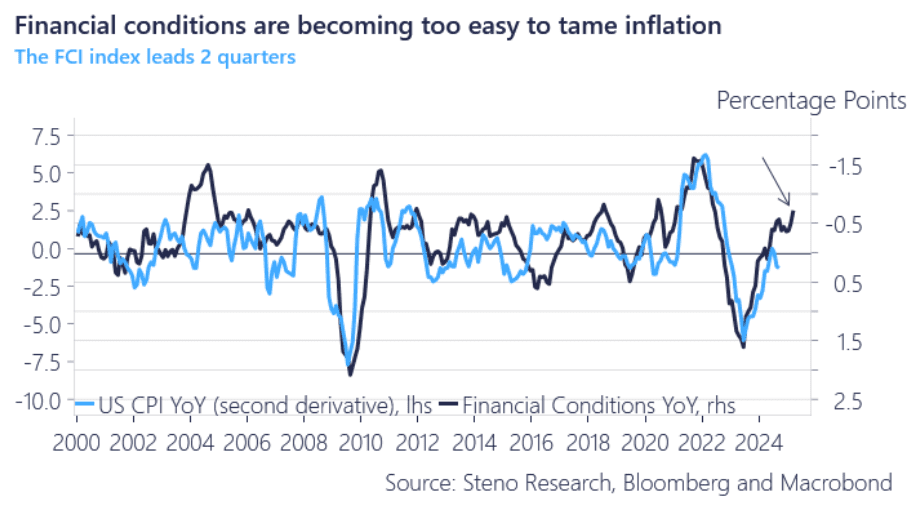
Interest rates, while higher, are not yet restrictive enough to significantly cool speculative behavior. Even if the Fed cuts rates less than the market anticipates, financial conditions remain accommodative. In fact, these relatively loose conditions may do more to fuel speculative behavior rather than deflate it. As long as rates remain at current levels or decline further, the risk of popping the bubble seems minimal—if anything, it might intensify the ongoing rally.
Chart 6.a: What Financial Conditions?
Total Score: 21/35
Assessment:
The cumulative score indicates that while some bubble-like conditions are forming, we have not yet reached a full-blown top. Certain signals, such as high valuations in equities and AI-related stocks, elevated bullish sentiment, and record equity inflows, suggest increasing froth. However, other areas, such as leverage levels, forward purchases, and credit spreads, remain relatively subdued, tempering the overall risk.
Additionally, the Fed’s monetary policy remains accommodative, with interest rates not yet restrictive enough to significantly curb speculative behavior. This leaves room for further market expansion before the bubble risks popping.
The case for a no landing scenario remains compelling, particularly if the reflationary trends I’ve outlined continue to take shape.
Unto trading…
I plan to add risk on dips and keep riding the momentum in both equities and crypto markets. The wave isn’t over yet!
If you enjoyed this analysis, please share it with a friend—it helps a lot!
Until next time.
Sam
Please note that the content provided above is for informational purposes only and should not be considered financial advice. Always conduct your own research and consult with a qualified financial advisor before making any investment decisions.
Great piece sam, agree with you that this is only the start of the cycle.
What do you think about QT still being done, can this slow the pace of the rally?
Nice analysis 🔥